related courses
- Workshop (Excel using AI & ChatGPT)
- Certificate in Basic Computer (CBC)
- Certificate in Smart Typing (CST)
- Certificate in GST in Tally (C-GST)
career counselling
book 1
book 2

book 3

book 4

book 5

book 6


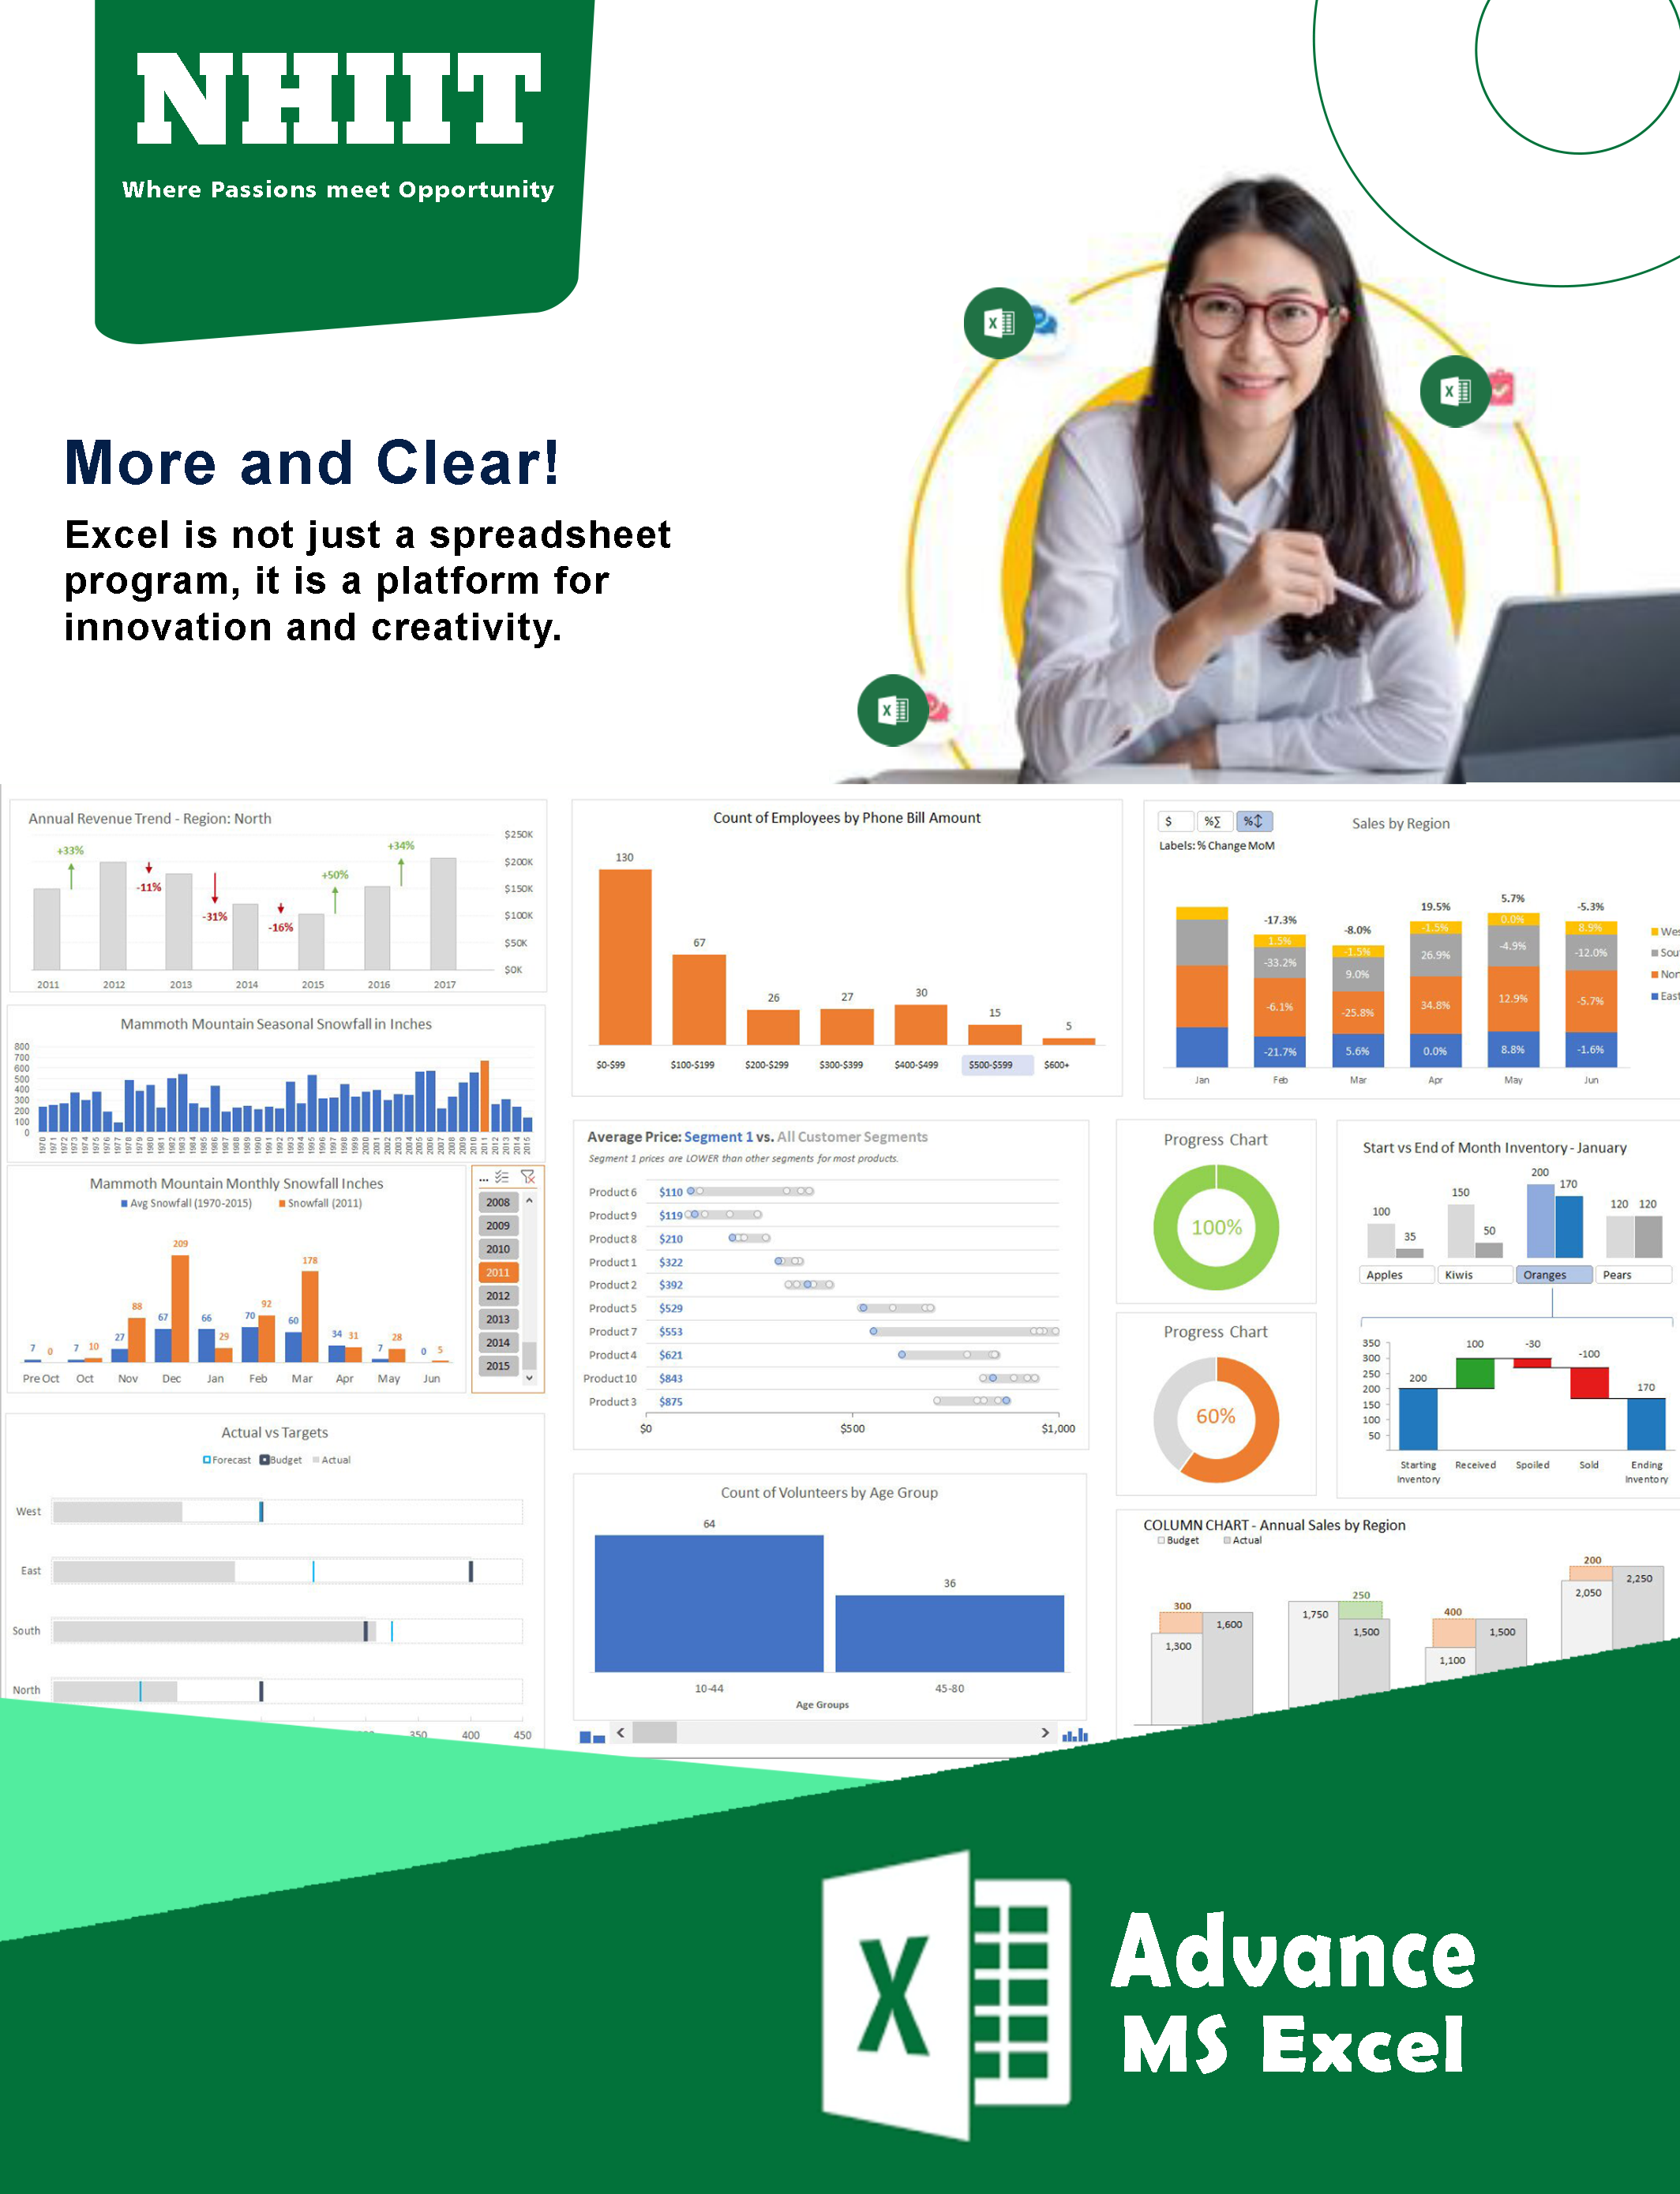
about course
As in modernization, every organization works on databases to analyze and visualize the things in the organization. Excel includes a large number of cells to format and manipulate the data and solve mathematical functions. You can organize the data in the spreadsheet using formulas, pivot tables, and graphic tools to present data. Excel helps to sort the data speedily and accurately with a comprehensive set of tools, using logical and look-up excel functions to transform, link, and analyze the data.
learning outcome
- You’ll be able to rearrange and reformate the data.
- You’ll be able to bring the important data from a bulk amount of data.
- You’ll be able to organize the data better by using excel functions, creative visualization, and impressive automation feature.
- You’ll be able to rearrange and reformate the data.
course highlights
| Duration | 3 Months or 36 Classes |
| Free books | 1 Books as Study Material |
| Examination | Online |
| Certification | Digital & Hard Copy |
| Prerequisites | Basic Computing |
software that you will learn in this course

course content
- An overview of the screen, navigation and basic spreadsheet concepts
- Various selection techniques
- Shortcut Keys
- Customizing the Ribbon
- Using and Customizing AutoCorrect
- Changing Excel's Default Options
- Mathematical Operations: Sum, Product, Power, Sqrt, Mod, Aggregate
- Conditional Sums: Sumif, Sumifs Advanced Mathematical Operations: Sumproduct, Su7nsq, Series sum.
- Other Operations: Round, Roundup, Round down
- Rand, Randbetween, Fact, Roman
- Data Lookup Functions: Vlookup, Hlookup
- Lookup, Choose, Match, get pivot data. Logical Functions: And, Or, Not, If, Iferror, Ifna, True, False.
- Cell/Range: Address, Index, Index, Offset
- Other Hyperlink, Transpose, Formula text
- Day, Hour, Minute, Month, Networkdays, Now, Second, Today, Weekday, Year
- Networkday.intl, Weeknum, Days360, Edate, EOMonth
- Pmt, Ppmt, Ipmt, PV, Fv, Rate
- . Iserror, Iserr, Isna.Error.Type, Isref, Iseven, Isodd, Isnumber, N, Isblank. Row, Column, Rows, Columns, Areas.
- Max, Min, Count, Counta, Countblank, Countif, Countifs
- Average, Averageif, Mode.sngl
- Mode.mult, Frequency, Rank, Rank.eq
- Len, Left, Right, Mid, Lower, Upper, Proper, rept.
- Substitute, Trim, concatenate,value, find, Replace, Char, Code
- Currency Format
- Format Painter
- Formatting Dates
- Custom and Special Formats
- Formatting Cells with Number formats, Font formats, Alignment, Borders, etc
- Basic conditional formatting
- Paste Formulas, Paste Formats
- Paste Validations
- Transpose Tables
- Filtering in Text, Numbers & Colors
- Sorting Options
- Advanced Filters on 15-20 different criteria(s)
- Setting Up Print Area
- Customizing Headers & Footers
- Designing the structure of a template
- Print Titles - Repeat Rows / Columns
- Goal Seek
- Scenario Analysis
- Data Tables (PMT Function)
- Solver Tool
- Number, Text, Date & Time Validation
- Custom validations based on formula for a cell
- Dynamic Dropdown List Creation using Data Validation-Dependency List
- Print Titles - Repeat Rows / Columns
- Creating Simple Pivot Tables
- Basic and Advanced Value Field Setting
- Classic Pivot table
- Choosing Field
- Filtering Pivot Tables
- Modifying PivotTable Data
- Grouping based on numbers and Dates
- Calculated Field & Calculated Items
- Arrays Functions
- What are the Array Formulas, Use of the Array Formulas?
- Basic Examples of Arrays (Using ctrl+ shift+enter).
- Array with if, len and mid functions formulas.
- Array with Lookup functions.
- Advanced Use of formulas with Array.
- Various Charts i.e. Bar Charts / Pie Charts / Line Charts
- Using SLICERS, Filter data with Slicers
- Manage Primary and Secondary Axis
- Planning a Dashboard
- Adding Tables and Charts to Dashboard
- Adding Dynamic Contents to Dashboard
jobs You’ll get after completing the course
Excel becomes an important tool and is always in demand by various organizations or institutions. People who specialize in using excel can work in MNC companies or either work as full-time employees or as a freelancer. Advance excel course opens up multiple career options that you can choose as your career path and get a higher handsome salary package, Below are some excel fields that you can choose for yourself after doing this course.
job profileafter completing this course |
average salary( 1+ year experience ) |
|---|---|
| data analyst | 36k - 94k |
| data analyst | 36k - 94k |
| MIS executive | 36k - 94k |
| market research analyst | 30k - 64k |
| project managers and coordinators | 38k - 117k |
| metrics and analytics specialist | 66k - 120k |
features & facilites